Realtime sentiment analysis application
Updated 18.03.2021 (1600 words)
Permalink : https://www.synaptec.ch/portfolio/realtime_sentiment_analysis/

Denis ELSIG
info at synaptec dot ch
Updated 18.03.2021 (1600 words)
Permalink : https://www.synaptec.ch/portfolio/realtime_sentiment_analysis/
At the beginning of 2020, when the COVID-19 pandemic began to spread, a lot of data scientists around the world were getting as much data as possible and tried to come up with tools that would help to understand what was happening. For the very first time in computer science, in a large community-based effort, engineers were wondering how they can contribute in helping to fight the disease using near real-time statistics, machine learning and more broadly artificial intelligence in the field of public health.
Almost everyone visited at least once one of the most iconic tool made by John’s Hopkins University. From a computer science perspective, this project might not look very impressive, but it is hiding very well the sheer complexity of data collection, aggregation, standardization and up to date information. Today, this tool is still one of the most used to understand the COVID-19 pandemic behaviour.
Other projects at local scale and with other goals were developed, with a focus on predictive modelling. They tried to explain epidemiological facts such as exponential propagation using the R factor. Very impressive visualisations were made and are still available to provide insights to the public or dashboards for decision makers.
Of course, I felt the call for a reflexion on this major event. I first followed the trends set by other engineers, but I quickly noticed that I wasn’t bringing much more to the table than what was already being done.
At that time, in February 2020, I had the intuition that it would be possible to evaluate trends from regions that didn’t provide any data. This idea was based on the observation of social networks : collecting enough messages trough API feeds, and processing them in real time, would give some insights. In short, it was indirect regional concerns detection.
For the application to work, the minimum structured data needed is as below.
Once the system starts to receive the data stream, a way to store it is needed. As we talk about gigabytes per day, an efficient system is needed. It follows the pattern below.
Every 5 minutes, or when the buffer is full (whichever comes first), the data is flushed to the disk as a flat CSV files.
A file watcher monitors any change when data is added. When is happens, according to what’s being observed (geographical region, chosen topic), each message is processed thanks to a previously trained sentiment analysis neural network. Eventually, the graphical interface is updated with the results.
Users sometimes cross post messages, so a way to de-duplicate them (but not the responses) is needed to prevent unbalance.
Despite being language-agnostic, a multilingual tokenization system with n-grams analysis capabilities produces relevant terms-frequency association.
The screenshot below is an early screenshot of the application. The parameters were set as follows:
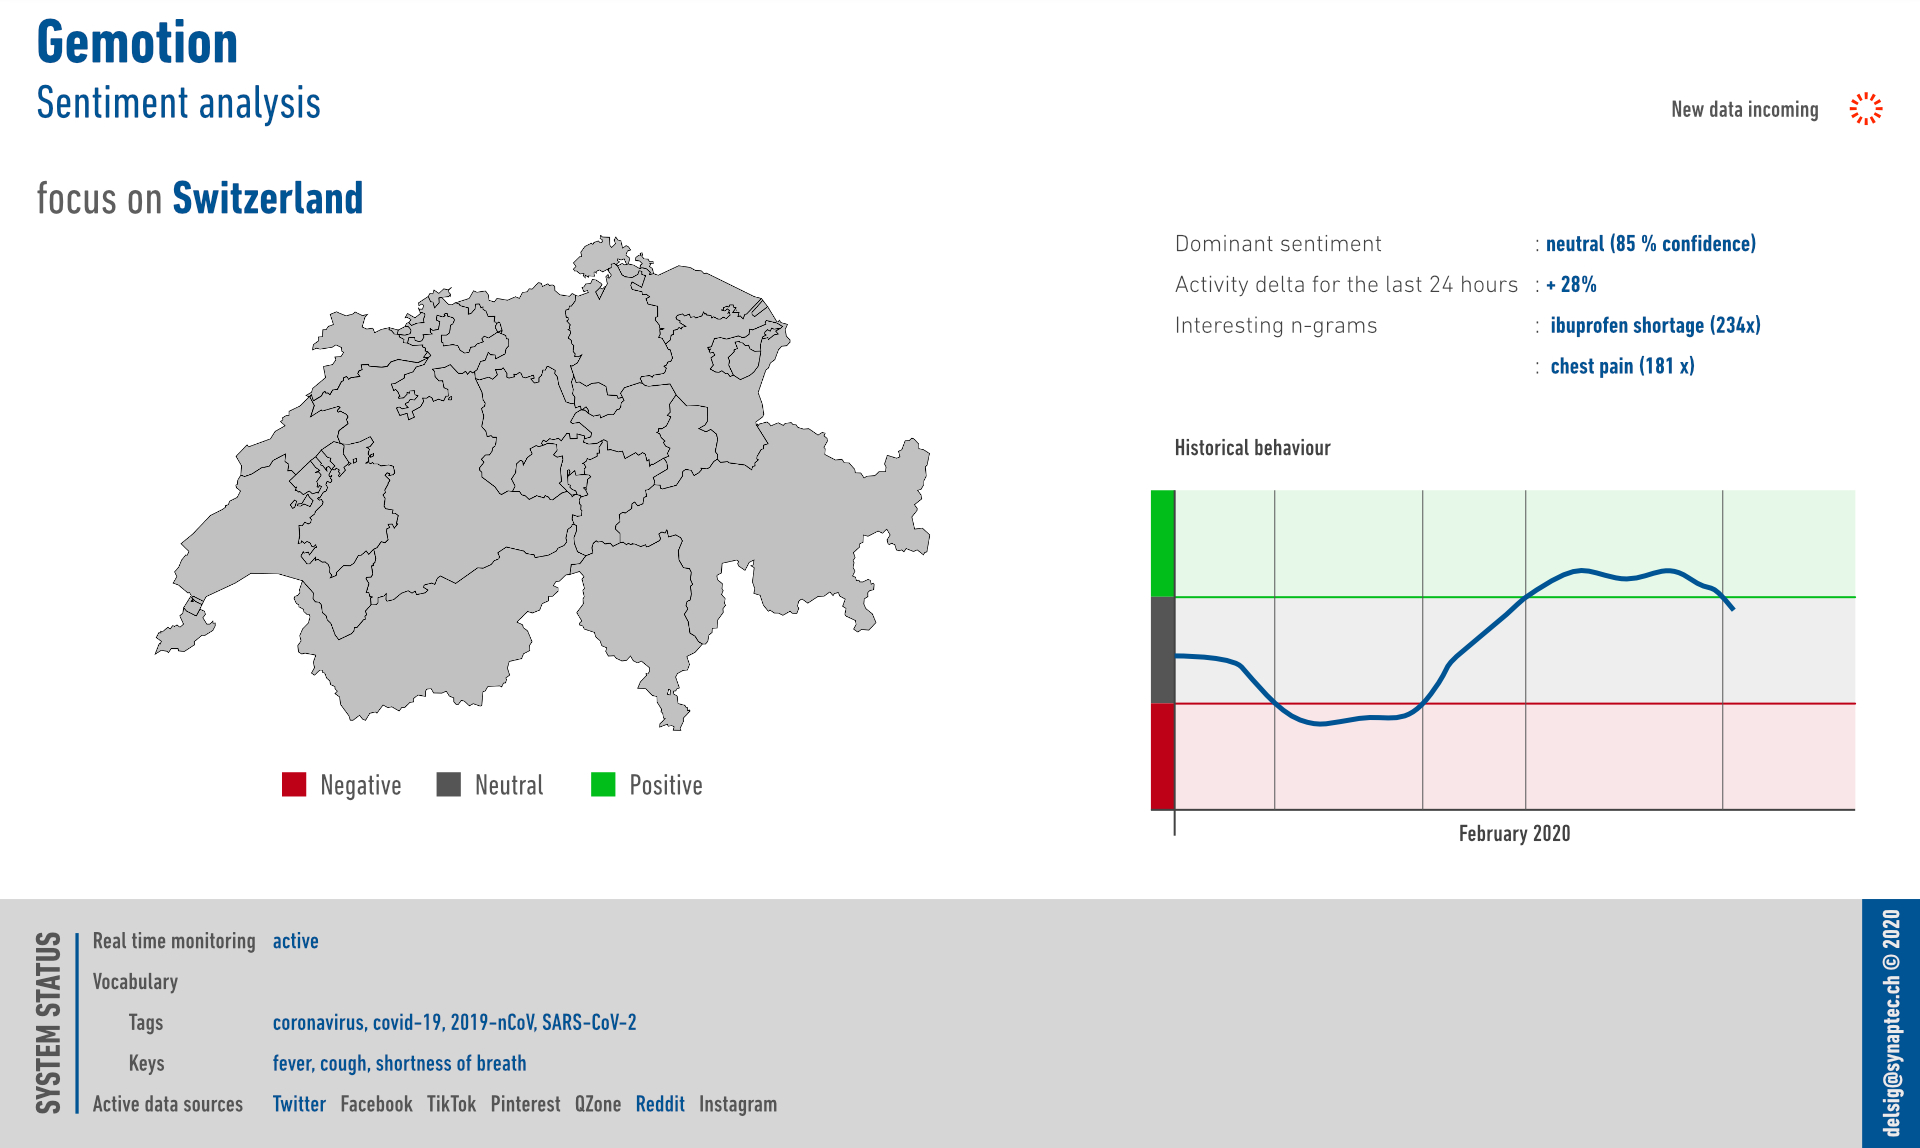
The application ran for 1 week in end of February 2020, successfully collecting data from social networks.
Interestingly, letting the application run for several days helped to discover a trend: the shortage of Ibuprofen. Note that at this time, a discussion was ongoing on whether it was advisable to use this drug in case of symptoms. The application correctly filtered relevant messages thanks to the provided settings and also discovered correctly a popular concern for this region.
This screenshot also shows that the system was working at a national level, and that using parameters in English was certainly not a good idea.
For the relevant messages, the sentiment was negative at first, rather neutral for a while and finally being slightly positive.
The discovered n-grams are displayed as well.
The results are highly biased because:
The results are by no means a precise measurement of what’s happening, and it’s impossible to extrapolate to a population. Nevertheless, on a positive side, it can surely help to discover trends in specific topics, offering some social intelligence.
The vast majority of social networks don’t provide free feeds through their API anymore. That means that the amount of data received depend on the amount of the subscription one agrees to pay. During the test, the application was using a free feed granted for research projects on Twitter, and a custom scrapper for Reddit.
Localization on Reddit is inferred from communities.
This application might answer the original question, that is to give some insights on regions that don’t provide data.
Is it useful or valuable? The short answer is yes and no.
Yes, potentially, but with the caveats mentioned above. It can raise awareness on raising topics discovered during the data analysis to suggest possible investigations.
No, regarding the COVID-19 specifically it doesn’t provide any scientific accurate result that could help decision-makers in the field of public health.
COVID-19 aside, this application provides:
Together, these functionalities form a powerful tool in the e-reputation, politics, finance or surveillance domains. It allows an indirect observation of topics.
Like every social monitoring tool, this application can be easily set to monitor populations. Source code modifications can also enable people tracking, social groups identification and mass surveillance.
In my view, this kind of tool has no place in democratic countries.
As a personal research project, it was interesting in the context of the COVID-19, but became quickly a double-sworded tool if used outside this context.
Only 2 social networks were implemented : Twitter and Reddit. For this prototype to work, it wasn’t necessary to implement all social networks.
This application exists as a functional prototype, but its development has been halted as it didn’t provide accurate enough results regarding the COVID-19 pandemic.
This prototype was developed using:
The neural network was previously trained in 2019 on a 140 GB data set consisting of Amazon reviews.
Python is a good language for rapid prototyping or testing ideas, but it would not be my first choice for desktop applications or computer intensive tasks. It has a very dynamic community in the data science field and provides a rich set of libraries but, being an interpreted language, it is inherently inefficient when large amount of data must be processed. A lot of optimizations were made using multithreading, parallel batch processing or GPU offloading when possible, but the performance remains sub-par compared to more low-level languages.
After having a proof of concept made with Python, I would consider other technologies to achieve production-grade performance. Candidates are: